
Revenue attribution assigns dollar credit to every interaction a donor has with your organization on their way to giving, whether that’s a click, a form submission, or an in-person meeting with a major gift officer. Done well, revenue attribution shows which channels, assets, and strategies move supporters toward a donation.
Nonprofit marketers have no shortage of data. The tricky part is figuring out what that data tells you about what drives revenue. Erin Cavender-Sharma, CauseMic’s Deputy Director of Growth Marketing Services, explains how revenue attribution in HubSpot can help nonprofits understand which interactions contribute most to donations, and which ones aren’t worth the effort.
Meet the Speaker
-

Erin Cavender-Sharma
Deputy Director of Growth Marketing Services, CauseMic
Erin leads CauseMic’s Growth Marketing Services, and has made a career of building marketing strategies for Fortune 500 companies and nonprofits alike. Her approach blends data insights with impact storytelling to connect with supporters at every stage of the donor funnel.
Chapters
Transcript
Maximizing Your Marketing Revenue with Attribution Reporting
Conference presentation, delivered by Erin Cavender-Sharma, Deputy Director of Growth Marketing Services at CauseMic
Revenue attribution can help nonprofit marketers understand which interactions contribute to donations and use that information to make more informed decisions about their marketing strategy. Erin Cavender-Sharma, Digital Marketing Strategist at CauseMic, walks through the attribution models available in HubSpot, how to build a revenue attribution report, and how to interpret the results without treating attribution data as absolute truth.
Attribution Models for Tracking Revenue
Revenue attribution modeling is the process of assigning credit to each interaction a donor has with your organization along their path to giving. Those interactions can include digital activities captured in HubSpot, such as clicks, page views, form submissions, and event registrations. You can also assign credit to offline interactions, such as a fundraising gala or a meeting with a major gift officer, as long as those interactions are tracked in HubSpot.
The credit is expressed in terms of dollars. If a donor interacts with your organization three times and then makes a $100 donation, the attribution model determines how that $100 is distributed across those interactions. One model might assign $50 to the first interaction, $30 to the second, and $20 to the third. When you pull the report, you'll see those interactions represented as the corresponding dollar amounts.
Revenue attribution can help answer specific questions about donor behavior, including which channels, assets, activities, or marketing approaches are helping move people toward a donation. It can help identify what is engaging donors and what may be making them more willing to give. But attribution models are a tool in your reporting toolbox, not a silver bullet. They have important blind spots, and understanding those limitations is essential to using the data responsibly.
The biggest limitation is that attribution reports are tied to interactions that are actually tracked in HubSpot. A person scrolling past an organic social post without engaging with it may never appear in the report. Someone attending a volunteer event that isn't being captured in the system, or seeing a billboard, may also be invisible to the model. Attribution reports also don't have visibility into your marketing budgets, so they don't inherently tell you return on investment. And while revenue is an important organizational metric, it isn't the only measure of a healthy organization or brand. Brand awareness, loyalty, engagement, and community building can all be valuable even if they are underrepresented in a revenue attribution report.
For those reasons, attribution should be used directionally. Look for trends, patterns, and areas where you need to investigate further rather than treating the results as absolute truth.
Choosing the Right Attribution Model
The linear model is probably the most straightforward attribution model because it assigns equal credit to every interaction along a donor's path to giving. If you're just getting started with revenue attribution, linear is a good place to begin because it provides a holistic view of the donor journey without prioritizing one interaction over another.
Time decay is generally well suited for short, time-bound campaigns because it gives more credit to recent interactions. It uses a seven-day half-life, meaning an interaction that happened eight days before a donation would receive half the credit of an interaction that happened the day before the donor gave. This makes it useful for questions such as how well a Giving Tuesday campaign performed, which channels contributed during year-end, or which activities were most effective during a summer fundraising campaign.
The W-shaped model looks at three landmark points in the donor journey: the first interaction, the interaction where the donor became categorized as a lead, and the interaction where they ultimately converted. Each of those receives 30% of the credit, with the remaining 10% distributed across the other interactions. This makes W-shaped attribution useful when you want to understand how upper- and middle-funnel activities work together to eventually produce donors.
There are also several other models worth understanding. First-touch attribution gives 100% of the credit to the first interaction, making it useful for questions about how new donors are discovering your organization. Last-touch attribution gives 100% of the credit to the final conversion interaction, helping identify what ultimately gets an engaged donor across the finish line. U-shaped attribution assigns 40% to the first interaction, 40% to the lead-creation interaction, and distributes the remaining 20% across the interactions in between. It's particularly useful when you're focused on the upper funnel and identifying where potential leads are coming from so you can cultivate them toward a later conversion.
The key is to choose the attribution model based on the marketing question you're trying to answer. Linear is useful for holistic questions such as which channels donors engage with before donating or how your overall combination of channels and assets is driving revenue. Time decay is better suited to individual, time-bound campaigns. W-shaped can help you understand how upper- and middle-funnel activities contribute to people who ultimately become donors. First touch is useful when you're trying to acquire new donors and understand how people first discover your organization. Last touch focuses on the final engagement that converts a donor. U-shaped can help you understand where to activate when you're trying to generate and cultivate leads.
Measuring Revenue Attribution in HubSpot
Before building an attribution report, make sure the underlying data is strong. An attribution report is only as good as the data informing it. If you don't have confidence in the data coming into your system, it's difficult to have confidence in the resulting report.
First, your website should either be hosted on HubSpot or have HubSpot web tracking enabled so that interactions with the site can be captured. Your donation platform also needs to be integrated with HubSpot so that conversions are recorded. If you're using an intermediary platform such as Salesforce, you can connect it using a custom behavioral event to track those conversions. Ad accounts and social media accounts should also be connected so that those interactions are included in the reporting.
Offline events are another important consideration. Teams should agree in advance on how those interactions will be tracked. If development tracks offline events one way and communications tracks them another way, the information may not flow into the report consistently. That can result in credit being assigned incorrectly or valuable insights being missed. For example, you might think one marketing channel is driving a large number of conversions when the real driver is meetings with a major gift officer. Aligning on tracking also helps the entire organization understand how attribution results should be interpreted.
Once the data is in place, select your report type. For revenue attribution, the relevant report is the multi-touch revenue attribution report, which is available within Marketing Hub Enterprise. HubSpot also offers deal-create attribution, which helps identify where new deals are coming from, and contact-create attribution, which focuses on new contacts and leads, but the focus here is multi-touch revenue attribution.
From there, select your chart type, date range, and attribution model. Be thoughtful about the date range, especially for time-bound campaigns. It can be tempting to make the reporting period exactly match your campaign dates, but that can leave out interactions that happen just before or after the campaign. If you're tracking something like a QR code from direct mail, for example, there may be additional activity that comes in later. Starting with a wider date range gives you the flexibility to narrow it down later.
You can also use more than one attribution model when your chart type allows it. If you're trying to answer multiple marketing questions, it may make sense to compare multiple models. The guiding principle remains the same: multiple questions can require multiple attribution models.
Next, choose your dimensions. Dimensions determine how the data is grouped in the report. You might compare campaigns, asset types, individual asset titles, or interaction sources. Campaign-level reporting lets you compare individual campaigns, while asset type can show how web pages, blog posts, and marketing emails perform relative to one another. Asset title gives you a much more granular view, while interaction source allows you to compare channels such as paid social, organic social, and email.
Finally, add your filters carefully. It's easy to narrow a dataset so much that you lose useful context. If you're only looking at a couple of interaction sources, for example, you may miss important information from other channels that changes your understanding of the donor journey. When in doubt, start broader and pull out learnings later. It's also important to include both sales and marketing interactions whenever possible so you're seeing the fullest picture.
Before running the report, do a quick "smell check." Do the configurations make sense? Can you explain why you chose the attribution model, dimensions, date range, and filters? If you don't understand why you configured the report a certain way, someone else looking at the results won't understand it either.
Actioning Your Learnings
There are generally two reasons to pull revenue attribution reports. One is to evaluate campaign activity, which is typically short and time-bound. The other is to identify changes or optimizations to always-on activities that run continuously in the background, such as organic social or your website.
Campaign Example: Giving Tuesday
Imagine you're a fundraiser trying to determine which channels to activate for a summer fundraising campaign you've never run before. One useful source of comparable information might be your organization's Giving Tuesday campaign from the previous year.
Because the question is which channels contributed most to revenue during a time-bound campaign, the report would use multi-touch revenue attribution with the time-decay model. If you're interested in channel mix, the dimension would be interaction source, and you could filter the report to Giving Tuesday.
The resulting report might show direct mail responsible for $272,000 in Giving Tuesday revenue. That's useful information, but it doesn't automatically mean you should increase your direct-mail investment. The attribution model doesn't know how much the direct-mail campaign cost. If you mailed a very large list and included a personalized gift with every mailer, for example, the cost could be substantial and the return on investment much lower than the revenue figure alone suggests. Attribution tells you where to investigate; you still need to evaluate the economics of the channel.
Marketing email might have contributed $180,000 in Giving Tuesday revenue. That could be a strong signal to examine your email performance more closely and identify which specific emails were most effective. Because email is an owned channel, ROI is generally less of a concern, but you still want to understand what worked so you can replicate it in the next campaign.
Paid search might have generated $56,000 according to the attribution model, making it the strongest-performing paid digital channel. Again, that result should be validated against actual ROI before reallocating budget. If multiple paid channels have comparable ROI but one is producing more attributed revenue, you might explore shifting some investment from a less effective channel toward the stronger one.
Organic social might show $112,000 in attributed revenue. That doesn't necessarily mean you should eliminate organic social. Passive brand exposure isn't captured by the model when someone sees a post but doesn't interact with it. If your team needs to make difficult decisions about where to invest its time, however, attribution data could prompt you to investigate whether some of that effort should shift toward channels such as direct mail or email while maintaining a baseline presence in organic social.
The point isn't to look at the report and immediately change your strategy. It's to use the data to identify where you need to dig deeper so you can make more informed decisions.
Always-On Example: Blog Content
For an always-on example, imagine a dog rescue organization trying to understand which blog topics are most effective at driving revenue. Ideally, the blog is doing several things at once: building community, engaging volunteers, and supporting fundraising. But if revenue is the immediate focus, attribution can help identify which topics are associated with donations.
Because we're looking at overall performance across an entire year rather than a specific campaign, the linear model makes sense. The dimension can be asset title, allowing you to compare individual blog posts, and the report can be filtered to blog content.
The results might show that posts about choosing the right pet insurance, caring for a puppy during its first 90 days, and helping a new dog acclimate are substantially outperforming more seasonal or evergreen topics. The initial takeaway could be that content focused on people who have recently brought a new dog into their home is particularly effective at driving revenue.
That doesn't mean the organization should publish new-dog content forever. Focusing on one topic for too long can create creative fatigue, so the organization would want to explore new creative approaches that remain within that broader area of interest while continuing to monitor performance over time. Again, the attribution report is helping identify a pattern worth exploring rather than dictating the entire content strategy.
How Often Should You Review Attribution?
The appropriate reporting cadence depends on the amount of activity an organization produces and the length of its donation cycle. For organizations getting started, quarterly is a good cadence because it generally aligns with quarterly planning and gives the team an opportunity to capture learnings and make strategic adjustments before the next quarter.
Audience Q&A
How much data do you need before attribution becomes meaningful?
It depends on the volume of traffic and events your organization is recording. A smaller organization with relatively little website traffic may need a year or two before it has enough data to identify meaningful patterns. Five people doing something isn't necessarily a trend, while 500 or 5,000 people may provide a much stronger signal. Organizations should look at their traffic sources, website activity, donation volume, and, where appropriate, statistical significance when determining whether they have enough data to draw conclusions. It's also useful to examine where people are dropping out of the donor journey if you have the ability to measure those points.
Should you bring historical data into HubSpot?
More data can be valuable as long as you have confidence that the data is accurate. If you're unsure about the validity of historical data being migrated into HubSpot, that's something to investigate before relying on it. One approach is to establish a clear cutoff point and move forward with a clean dataset from there. However, starting with reliable historical data can help you reach meaningful patterns more quickly, while recognizing that statistical significance still takes time to develop.
Can you filter attribution reports by specific content types or interactions?
Yes. HubSpot's filtering capabilities allow you to exclude specific interaction types or individual assets. For example, if you know that four particular blog posts were heavily promoted, you could exclude those posts to examine their more organic performance. You can also use campaign filtering to focus on specific campaigns or impact areas, or look at every email sent over a particular period and identify which ones performed best.
The goal is to identify commonalities. If the top-performing emails shared a particular type of content, were sent to the same audience, or used a particular approach, those patterns can become hypotheses that you test in future campaigns. It's also useful to look at your regular email reporting outside of the attribution report as another data point that can validate or challenge what you're seeing.
How can you use interaction sources and UTMs?
Interaction source can help identify where traffic is coming from, such as direct traffic or an integrated platform. If you're using UTM parameters in an email campaign, you can also filter reports using those parameters when that information is available in the underlying data. The more consistently your organization uses tracking conventions, the more useful those dimensions become when you're trying to understand which sources and campaigns are contributing to revenue.
Closing
Revenue attribution can provide nonprofits with a useful way to connect marketing activity to revenue, but the most valuable use of the data is not simply reporting a number. Attribution can help identify trends, patterns, and questions worth investigating. Choosing the right model for the question, maintaining strong underlying data, understanding the blind spots, and validating findings against other sources of information all make the resulting insights more useful.
The goal is to use attribution reporting as one part of a broader decision-making process. When nonprofits combine attribution data with their understanding of donors, campaigns, content, costs, and organizational goals, they can build a more informed picture of what's working and where there may be opportunities to improve.
This transcript has been lightly edited using AI for clarity and readability, with filler language and audience Q&A introductions removed.
-
 Watch now about Paving the Path to Give: Reducing Donation Form Friction with Fundraise Up
Paving the Path to Give: Reducing Donation Form Friction with Fundraise Up
Sal Salpietro explains the "Friction Tolerance Threshold" and how it can help nonprofits reduce donor friction and boost engagement. He discusses how to optimize donation forms, personalize donor experiences, and increase conversions without a big budget ...
-
 Watch now about Making Moments Matter: How Nonprofits can Harness the Power of Earned Media
Making Moments Matter: How Nonprofits can Harness the Power of Earned Media
Jessica Bryant from Save the Children Canada explains how nonprofits can harness earned media to boost engagement, build trust, and drive impact. She discusses strategies for effective media engagement during her talk at the Nonprofit HubSpot Summit.
-
 Watch now about Tomorrow’s Emergencies Today: Five Tactics for Tackling Emergency Marketing Moments
Tomorrow’s Emergencies Today: Five Tactics for Tackling Emergency Marketing Moments
Reilly Hay, Email Marketing Manager at Partners in Health, discusses emergency marketing and communications efforts for nonprofits at the Nonprofit HubSpot Summit.
-
 Watch now about How to Run a Retrospective
How to Run a Retrospective
A simple way to improve how your team runs campaigns? The retrospectives. Matt Scott, cofounder and CEO of CauseMic, walks through the six-step process that gives your team the tools they need to figure out what worked, what didn’t, and what to do ...
-
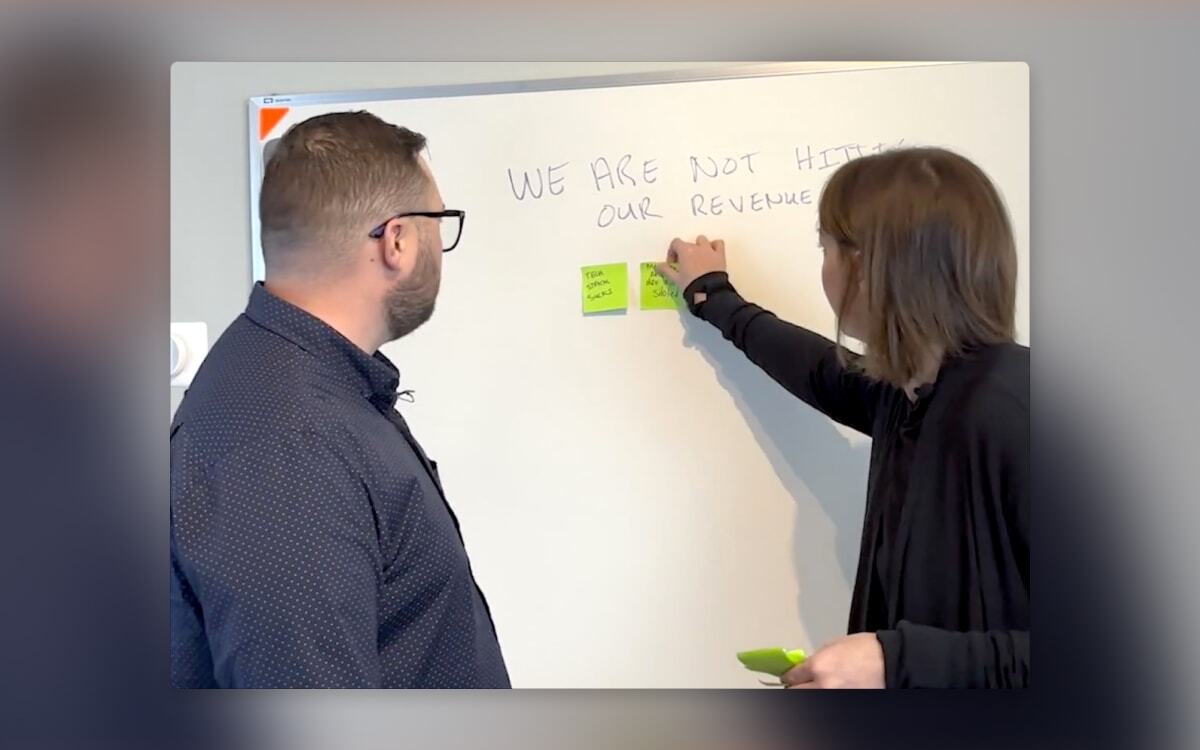 Watch now about How to Use CauseMic’s Problem-Solving Framework
How to Use CauseMic’s Problem-Solving Framework
Trade run-of-the-mill brainstorming meetings for a process that gets you more ideas, clearer decisions, and actionable next steps. Matt Scott and Bobbi Snethen walk through CauseMic’s framework for turning any team problem into a clear, prioritized ...
-
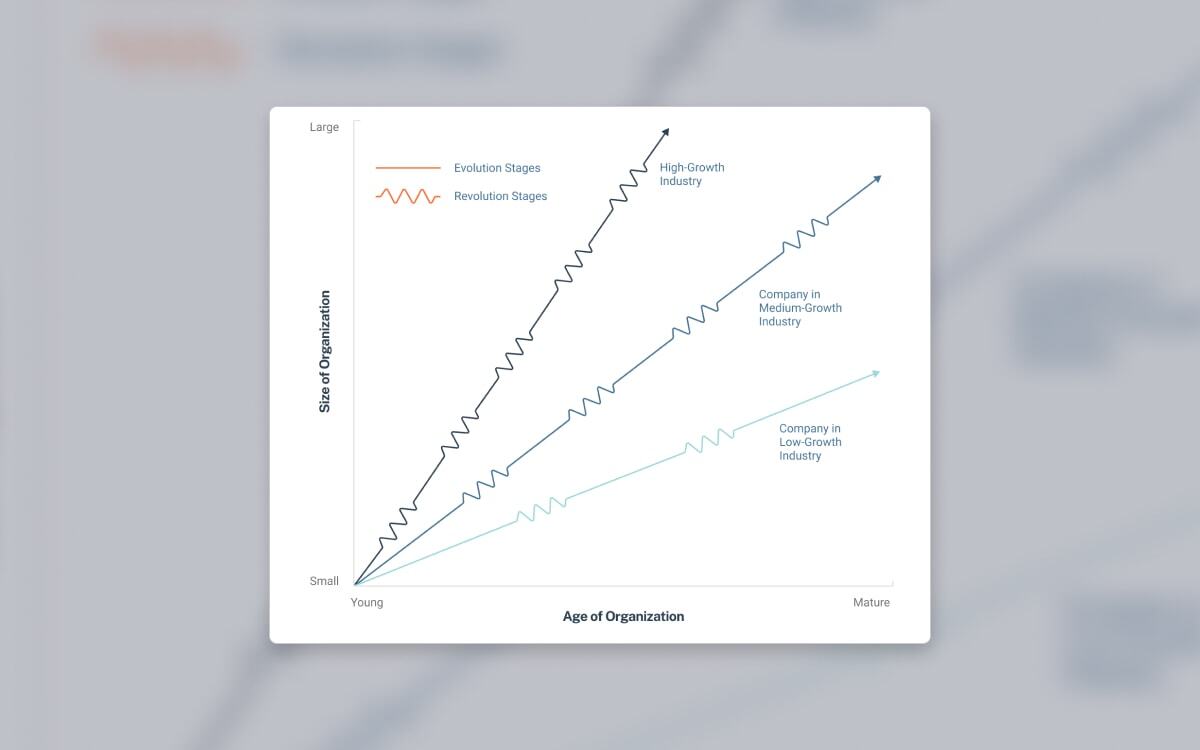 Read the article about Phases of Growth and Crisis in the Life of Nonprofits
Phases of Growth and Crisis in the Life of Nonprofits
Every nonprofit experiences growing pains. Ironically, most of them are caused by the same decisions that made growth possible. This article breaks down the five phases of nonprofit growth, the crisis that ends each one, and how to figure out which phase ...